SSFx Divergence Strategy - 1. Foundations of Divergence
Published onThis document explores the conceptual foundations of divergence trading. My goal is not to present divergence as a magical signal or prediction tool as is often the case online. Rather, it is to present it as a way of understanding internal market behavior. The behavior behind the structure if you will.
Divergence exists because markets are driven by pressure, participation, liquidity, exhaustion, and positioning. Indicators in this case simply provide a mathematical way to observe some of those underlying dynamics.
This document forms the foundation (or starting point) for the exploration of a strategy I have developed that uses divergence as an extra confirmation for entries and exits. However, one must remember that divergence itself is not a signal. Divergence is evidence.
What Indicators Actually Are
A lot of traders eventually become obsessed with indicators without understanding what the indicator they are working with really is. An indicator is not an intelligent entity. It does not know where price would go or understand institutions, news, fear, greed, or liquidity. An indicator is simply a mathematical transformation of price data. This is extremely important as it changes how divergence should be interpreted.
Price itself is the final visible outcome of buying and selling decisions occurring inside the market. Indicators in this case attempt to describe aspects of that behavior mathematically. This can be seen in how different indicators measure different properties of the underlying market;
- RSI measures relative momentum strength
- Stochastic measures closing position inside a range
- MACD measures trend acceleration and deceleration
Based on the breakdown above, it is evident that none of them predict the future directly. They merely describe (or showcase) how price has behaved.
Price Versus Internal Dynamics
From the breakdown above, one can observe that price shows what happened while indicators show how strongly it happened. This leads us to one of the most important concepts in divergence trading - Understanding the difference between price and internal dynamics.
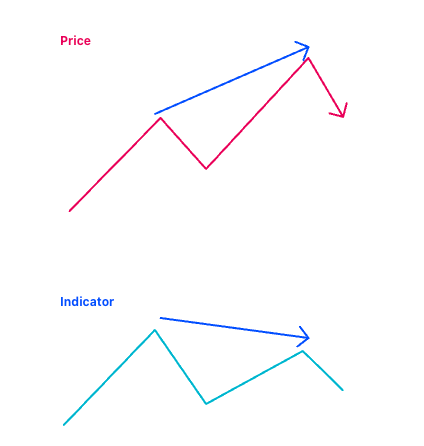
The distinction between price and indicator data explains how divergences can exist in the first place. For example, price may continue making higher highs while the underlying momentum behind those highs weakens. The market is still moving upward, but the efficiency and force of the movement changes internally. This is the foundation of bearish divergence.
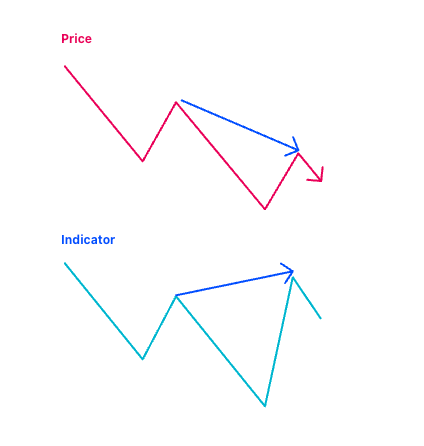
Similarly, price may continue making lower lows while selling momentum weakens internally. This is what divergence traders refer to as bullish divergence. In this regard, divergence therefore simply becomes a disagreement between visible outcome and internal behavior. It is not magical.
Core Idea Behind Divergence
Divergence appears when price and internal dynamics stop behaving in agreement. In a healthy bullish trend;
- Price makes higher highs
- Momentum also strengthens
The same applies to a healthy bearish trend where;
- Price makes lower lows
- The bearish momentum also strengthens
Divergence therefore occurs/appears when this basic alignment weakens. In bearish divergence;
- Price still makes higher highs
- However, the bullish momentum weakens internally
The opposite is true for bullish divergence where;
- Price makes lower lows
- However, the bearish momentum weakens internally
Please note that the market still moves in the same direction. However, the internal force behind the movement becomes less effective.
A Better Model - Effort vs Result
A better model or rather more useful way to think about divergence is through the concept of effort versus result. Strong healthy trends usually produce large movement with relatively little resistance. Weak exhausted trends require increasing effort for smaller and smaller progress.
An example of this would be;
- Earlier in the trend: One would see the market making such movements +50pips, +60, +70, etc.
- Late in the trend: +20pips, +10, +5.
Basically, price continues upward, however, the momentum/strength weakens because each new push becomes less efficient. Of course, this might be due to various reasons.
However, regardless of the reasons, it is evident that a change has occurred. Indicators often detect this inefficiency before the market visibly reverses.
The “WHY”
Divergence does not occur randomly. Several underlying market dynamics can produce it. While we might not cover all of them, we will mention some of the most notable ones. These include;
- Liquidity absorption
- Trend fatigue
- Large participant positioning
- Short covering
- Accumulation & distribution
- Declining participation
- Volatility shifts
All of these can cause price to continue moving while the internal behavior/dynamics of the move weakens.
Liquidity Absorption
Liquidity absorption occurs when aggressive buying or selling is absorbed by opposing participants without allowing price to move efficiently. For example: Aggressive sellers repeatedly hit the market, yet price barely falls. This happens because larger buyers absorb those sell orders. This creates an important imbalance:
- Selling effort increases
- Downward result weakens
Indicators such as RSI often detect this weakening before price visibly reverses. Bullish divergence frequently appears during this type of absorption. As a result, divergence would appear as a precursor/early evidence prior to a reversal.
NOTE: This does not imply causation. Just because divergence can be seen before a reversal does not mean it caused the reversal. It is correlated and can be viewed as an early indication that a reversal is more likely. However, it is in no way a sure-fire indicator that the market will reverse.
Trend Fatigue
Trend fatigue occurs when a trend continues but loses internal strength over time. For example;
Early in a trend:
- Momentum expands easily
- Participation is strong
- Price moves efficiently
Later in a trend:
- Momentum weakens
- Reactions become slower
- Price struggles to continue
The trend may still technically remain intact, but the internal energy behind it begins to fade. This is one of the most common causes of divergence.
Large Player Positioning
Large institutional participants cannot instantly enter or exit massive positions without moving the market against themselves. As a result, they often build positions gradually. In this regard, retail traders may see:
- Random ranging
- Indecision
- Repeated failed moves
Meanwhile, institutions may quietly:
- Accumulate long positions
- Distribute long positions
- Absorb liquidity
This gradual positioning process can create divergence because price movement becomes less efficient internally.
Short Covering
Short covering occurs when traders who previously sold the market buy back their positions to exit. Closing a short position requires buying (the opposite is true for buy positions - closing them requires one to sell). This buying pressure can create temporary rallies even inside bearish markets. This explains why some bullish divergences produce only short lived bounces rather than full reversals. Sometimes divergence reflects:
- Temporary short covering rather than
- True accumulation and trend reversal
Accumulation & Distribution
Accumulation occurs when large participants slowly build long positions while the public continues selling. In effect, this is almost similar to the large player positioning explored above. Distribution occurs when large participants slowly reduce long exposure while the public continues buying. An example of this would be the following;
During accumulation:
- Price may continue falling slowly
- Bearish momentum weakens
- Bullish divergence may appear
During distribution:
- Price may continue rising slowly
- Bullish momentum weakens
- Bearish divergence may appear
These processes explain why divergence often appears before larger reversals.
Divergence Types
There are three main types of divergences that can be seen in the market. Two of these are fairly popular among traders while the last one is less popular.
Regular Divergence
Regular divergence is generally associated with possible reversal conditions. Bearish regular divergence:
- Price makes a higher high
- Indicator makes a lower high
Meaning:
- Buyers still pushed price upward, but with weakening internal strength.
Bullish regular divergence:
- Price makes a lower low
- Indicator makes a higher low
Meaning:
- Sellers still pushed price downward, but the bearish force weakened internally.
Regular divergence suggests possible exhaustion
Hidden Divergence
Hidden divergence is generally associated with continuation. Hidden bullish divergence:
- Price makes a higher low
- Indicator makes a lower low
Meaning:
- Despite temporary weakness internally, buyers successfully defended structure.
Hidden bearish divergence:
- Price makes a lower high
- Indicator makes a higher high
Meaning:
- Despite bullish momentum internally, sellers prevented price from reclaiming previous highs.
Hidden divergence often appears during trend continuation phases
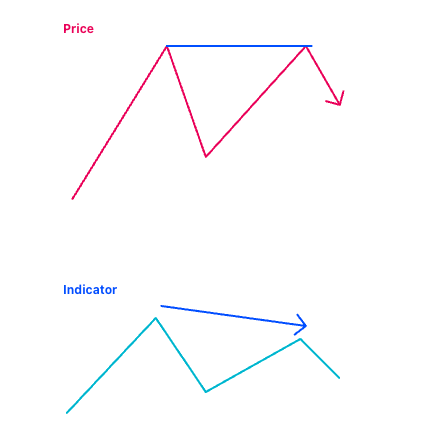
Exaggerated Divergence
Exaggerated divergence occurs when price forms roughly equal highs or lows while the indicator changes significantly.
Example:
- Price forms double top
- Indicator forms lower high
This often signals weakening momentum beneath an apparently stable structure. Exaggerated divergence is common around:
- Double tops
- Double bottoms
- Liquidity sweeps
Understanding Momentum/Market Dynamics in Divergence
In this and other documents that I will be releasing, I constantly mention momentum. In this case, I am often referring to the way the market moved as opposed to actually trying to measure the momentum. Additionally, since the model I will be presenting uses the RSI internally, momentum is included in my bread and butter. In any case, let us explore “momentum” in divergence and how one can wrap their heads around this relationship.
A lot of traders become confused as to what is actually weakening during divergence. When dealing with bearish divergence, this doesn’t mean that bearish momentum is increasing. Rather it indicates that bullish momentum has weakened internally. The opposite is true for bullish divergence. it doesn’t imply that bullish momentum is increasing. Rather, it is referring to the notion that bearish price movement has continued and bearish momentum has weakened.
A rule of thumb to keep in mind is that ==Divergence measures weakening dominance, not immediate reversal strength.==
Healthy Trends vs Weak Trends
Since divergence measures weakening dominance, it is important to understand the difference between healthy and weak trends. Healthy trends typically show;
- Price agreement
- Momentum agreement
- Efficient movement
- Strong continuations
Weak trends often show;
- Momentum disagreement
- Repeated divergence
- Reduced efficiency
- Increased volatility
- Failed continuation attempts
In this regard, divergence becomes more meaningful when the market begins transitioning from healthy trend behavior towards inefficient behavior.
So why does Divergence Matter?
Divergence matters because markets rarely reverse instantly without a warning. Internal weakness often appears before visible structural change occurs. In this regard, divergence provides traders with a method for observing;
- Weakening momentum
- Absorption
- Exhaustion
- Participation shifts
- Possible vulnerability
Despite divergence indicating these factors, it is important to remember that Divergence alone does not confirm reversals. It merely signals that the internal conditions supporting the trend may be weakening.
The Most Important Principal
The most important principal in divergence trading is understanding that divergence is contextual. Divergence is not;
- Automatic reversal
- Certainty
- Prediction
It is;
- Information
- A Warning
- Evidence of changing internal behavior
The purpose of divergence analysis is not to predict perfectly. The purpose is to identify moments where market conditions may be changing beneath the surface before price structure fully reflects the change.